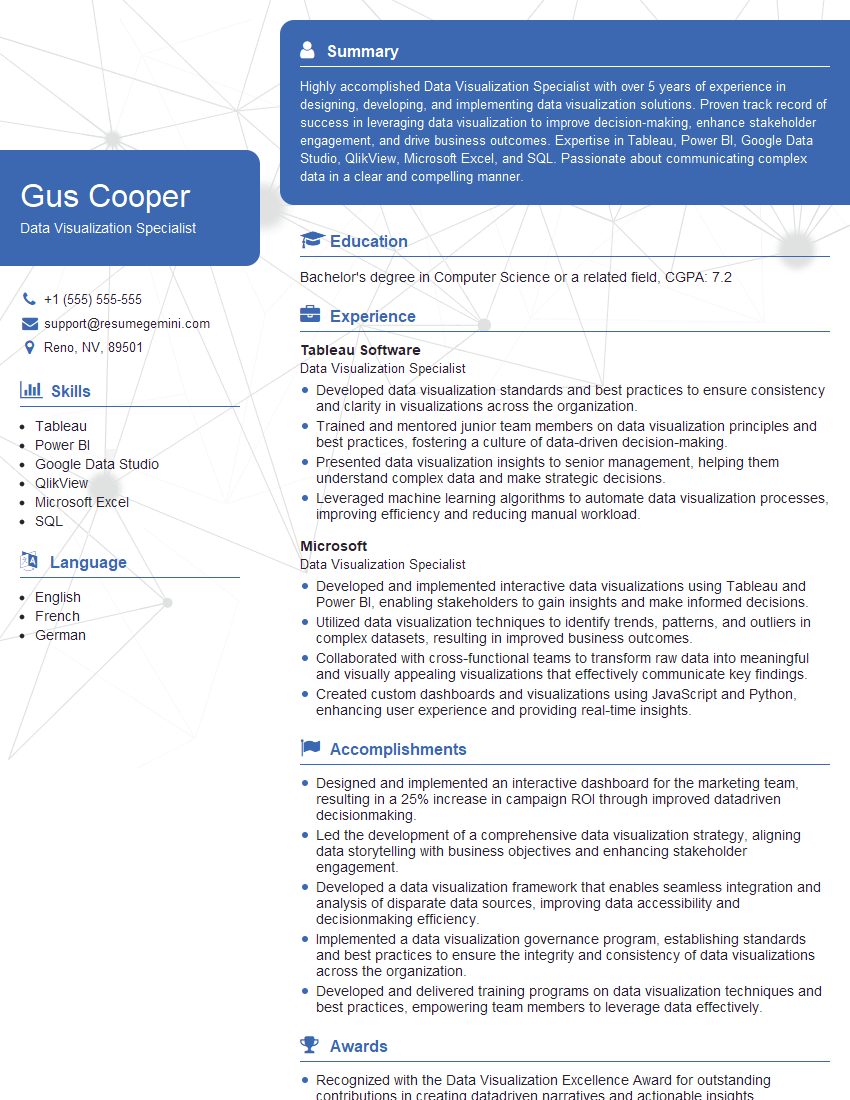
Are you a seasoned Data Visualization Specialist seeking a new career path? Discover our professionally built Data Visualization Specialist Resume Template. This time-saving tool provides a solid foundation for your job search. Simply click “Edit Resume” to customize it with your unique experiences and achievements. Customize fonts and colors to match your personal style and increase your chances of landing your dream job. Explore more Resume Templates for additional options.

Gus Cooper
Data Visualization Specialist
Summary
Highly accomplished Data Visualization Specialist with over 5 years of experience in designing, developing, and implementing data visualization solutions. Proven track record of success in leveraging data visualization to improve decision-making, enhance stakeholder engagement, and drive business outcomes. Expertise in Tableau, Power BI, Google Data Studio, QlikView, Microsoft Excel, and SQL. Passionate about communicating complex data in a clear and compelling manner.
Education
Bachelor’s degree in Computer Science or a related field
May 2016
Skills
- Tableau
- Power BI
- Google Data Studio
- QlikView
- Microsoft Excel
- SQL
Work Experience
Data Visualization Specialist
- Developed data visualization standards and best practices to ensure consistency and clarity in visualizations across the organization.
- Trained and mentored junior team members on data visualization principles and best practices, fostering a culture of data-driven decision-making.
- Presented data visualization insights to senior management, helping them understand complex data and make strategic decisions.
- Leveraged machine learning algorithms to automate data visualization processes, improving efficiency and reducing manual workload.
Data Visualization Specialist
- Developed and implemented interactive data visualizations using Tableau and Power BI, enabling stakeholders to gain insights and make informed decisions.
- Utilized data visualization techniques to identify trends, patterns, and outliers in complex datasets, resulting in improved business outcomes.
- Collaborated with cross-functional teams to transform raw data into meaningful and visually appealing visualizations that effectively communicate key findings.
- Created custom dashboards and visualizations using JavaScript and Python, enhancing user experience and providing real-time insights.
Accomplishments
- Designed and implemented an interactive dashboard for the marketing team, resulting in a 25% increase in campaign ROI through improved datadriven decisionmaking.
- Led the development of a comprehensive data visualization strategy, aligning data storytelling with business objectives and enhancing stakeholder engagement.
- Developed a data visualization framework that enables seamless integration and analysis of disparate data sources, improving data accessibility and decisionmaking efficiency.
- Implemented a data visualization governance program, establishing standards and best practices to ensure the integrity and consistency of data visualizations across the organization.
- Developed and delivered training programs on data visualization techniques and best practices, empowering team members to leverage data effectively.
Awards
- Recognized with the Data Visualization Excellence Award for outstanding contributions in creating datadriven narratives and actionable insights.
- Honored with the Tableau Visionary Award for pioneering the adoption of Tableau and driving datacentric innovations within the organization.
- Received the Data Viz Guru Award for exceptional proficiency in creating visually compelling and impactful data visualizations that effectively communicate complex insights.
- Recognized with the Best of Data Visualization Award for consistently delivering highquality and innovative data visualizations that drive business outcomes.
Certificates
- Tableau Certified Associate
- Tableau Certified Professional
- Power BI Certified Data Analyst Associate
- Power BI Certified Data Analyst Expert
Career Expert Tips:
- Select the ideal resume template to showcase your professional experience effectively.
- Master the art of resume writing to highlight your unique qualifications and achievements.
- Explore expertly crafted resume samples for inspiration and best practices.
- Build your best resume for free this new year with ResumeGemini. Enjoy exclusive discounts on ATS optimized resume templates.
How To Write Resume For Data Visualization Specialist
- Quantify your accomplishments with specific metrics and results.
- Highlight your expertise in specific data visualization tools and technologies.
- Showcase your ability to communicate complex data in a clear and engaging manner.
- Demonstrate your understanding of data visualization best practices.
Essential Experience Highlights for a Strong Data Visualization Specialist Resume
- Design and develop interactive dashboards and visualizations to communicate data effectively.
- Collaborate with stakeholders to understand their data needs and develop tailored visualization solutions.
- Implement data visualization best practices to ensure the integrity and consistency of data visualizations.
- Provide training and support to users on data visualization techniques and tools.
- Stay abreast of the latest trends and advancements in data visualization technology.
Frequently Asked Questions (FAQ’s) For Data Visualization Specialist
What is the role of a Data Visualization Specialist?
A Data Visualization Specialist is responsible for designing, developing, and implementing data visualization solutions to communicate data effectively. They work with stakeholders to understand their data needs and develop tailored visualization solutions that support decision-making, enhance stakeholder engagement, and drive business outcomes.
What skills are required to be a successful Data Visualization Specialist?
Successful Data Visualization Specialists typically have a strong foundation in data analysis, data visualization techniques, and visual design principles. They are proficient in data visualization tools such as Tableau, Power BI, and Google Data Studio. They also have excellent communication and presentation skills.
What are the career prospects for Data Visualization Specialists?
The demand for Data Visualization Specialists is growing rapidly as organizations increasingly recognize the value of data visualization in driving business outcomes. Data Visualization Specialists can find employment in a variety of industries, including technology, healthcare, finance, and retail.
What are the challenges faced by Data Visualization Specialists?
Data Visualization Specialists often face challenges related to data quality, data complexity, and stakeholder expectations. They must be able to work effectively with stakeholders to understand their needs and develop visualizations that are both accurate and engaging.
What are the best practices for creating effective data visualizations?
Effective data visualizations are clear, concise, and visually appealing. They use appropriate chart types and colors to communicate data effectively. They also tell a story and support decision-making.